Getting Started
This walks you through the full flow: start the server, register a model, send data, and watch dashboards appear.
Installation
YAAI ships as two things: a lightweight Python SDK and a self-hosted monitoring server.
pip install yaai-monitoring              # SDK only (httpx + pydantic)
pip install "yaai-monitoring[server]"    # Full server
pip install "yaai-monitoring[server,gcp]" # Server + Google Cloud support
Start the server
The fastest path is Docker Compose:
This starts PostgreSQL and the YAAI server. Open http://localhost:8000 -- you should see the login screen.
Default login: admin / check the server logs for the generated password.
Tip
For step-by-step server configuration, environment variables, and authentication setup, see:
- Server Setup -- local development with PostgreSQL, env vars, auth options
- Deployment -- production setup with Docker Compose, Google Cloud SQL
Option A: Use the Python SDK
Install the SDK (just httpx + pydantic, nothing heavy):
Then run this script. It registers a model, defines a schema, uploads reference data, and sends inference data -- everything you need for dashboards and drift detection to kick in.
import asyncio
from yaai import YaaiClient
from yaai.schemas.model import SchemaFieldCreate

async def main():
    async with YaaiClient("http://localhost:8000/api/v1", api_key="yaam_...") as client:

        # 1. Register a model
        model = await client.create_model(
            "churn-predictor",
            description="Predicts whether a customer will churn",
        )

        # 2. Create a version with its schema
        #    This tells YAAI what your model's inputs and outputs look like.
        #    Dashboards, drift metrics, and validation are derived from this.
        version = await client.create_model_version(
            model_id=model.id,
            version="v1.0",
            schema_fields=[
                SchemaFieldCreate(field_name="age", direction="input", data_type="numerical"),
                SchemaFieldCreate(field_name="income", direction="input", data_type="numerical"),
                SchemaFieldCreate(field_name="region", direction="input", data_type="categorical"),
                SchemaFieldCreate(field_name="churn_prob", direction="output", data_type="numerical"),
            ],
        )

        # Alternative: get_or_create_version is idempotent — it always needs
        # schema info, but ignores it when the version already exists.
        # With an explicit schema:
        #   version = await client.get_or_create_version(
        #       model_id=model.id,
        #       version="v1.0",
        #       schema_fields=[...],    # same list as above
        #   )
        # Or let YAAI infer the schema from a sample:
        #   version = await client.get_or_create_version(
        #       model_id=model.id,
        #       version="v1.0",
        #       sample_data={
        #           "inputs": {"age": 35, "income": 72000, "region": "west"},
        #           "outputs": {"churn_prob": 0.73},
        #       },
        #   )
        # For a pure lookup: await client.get_version_by_label(model.id, "v1.0")

        # 3. Upload reference data (your training distribution)
        #    This is the baseline that drift detection compares against.
        import random
        reference = [
            {
                "inputs": {
                    "age": random.gauss(35, 8),
                    "income": random.gauss(65000, 15000),
                    "region": random.choice(["west", "central", "east"]),
                },
                "outputs": {"churn_prob": random.random()},
            }
            for _ in range(500)
        ]
        await client.add_reference_data(model.id, version.id, reference)

        # 4. Send inference data (what your model sees in production)
        inferences = [
            {
                "inputs": {
                    "age": random.gauss(38, 10),  # slightly shifted
                    "income": random.gauss(62000, 14000),
                    "region": random.choice(["west", "central", "east", "south"]),
                },
                "outputs": {"churn_prob": random.random()},
            }
            for _ in range(200)
        ]
        await client.add_inferences(version.id, inferences)

        print(f"Done. Open http://localhost:8000 and navigate to {model.name}.")

asyncio.run(main())
Option B: Use the REST API directly
No SDK needed. Plain HTTP works just as well:
API_KEY="yaam_..."
BASE="http://localhost:8000/api/v1"

# 1. Create a model
MODEL=$(curl -s -X POST "$BASE/models" \
  -H "Content-Type: application/json" \
  -H "X-API-Key: $API_KEY" \
  -d '{"name": "churn-predictor"}')

MODEL_ID=$(echo $MODEL | python3 -c "import sys,json; print(json.load(sys.stdin)['data']['id'])")

# 2. Create a version with schema
VERSION=$(curl -s -X POST "$BASE/models/$MODEL_ID/versions" \
  -H "Content-Type: application/json" \
  -H "X-API-Key: $API_KEY" \
  -d '{
    "version": "v1.0",
    "schema": [
      {"field_name": "age", "direction": "input", "data_type": "numerical"},
      {"field_name": "income", "direction": "input", "data_type": "numerical"},
      {"field_name": "region", "direction": "input", "data_type": "categorical"},
      {"field_name": "churn_prob", "direction": "output", "data_type": "numerical"}
    ]
  }')

VERSION_ID=$(echo $VERSION | python3 -c "import sys,json; print(json.load(sys.stdin)['data']['id'])")

# 3. Send inference data
curl -s -X POST "$BASE/inferences" \
  -H "Content-Type: application/json" \
  -H "X-API-Key: $API_KEY" \
  -d "{
    \"model_version_id\": \"$VERSION_ID\",
    \"inputs\": {\"age\": 42, \"income\": 71000, \"region\": \"west\"},
    \"outputs\": {\"churn_prob\": 0.73}
  }"
What happens next
Once data starts flowing, open http://localhost:8000 and click into your model:
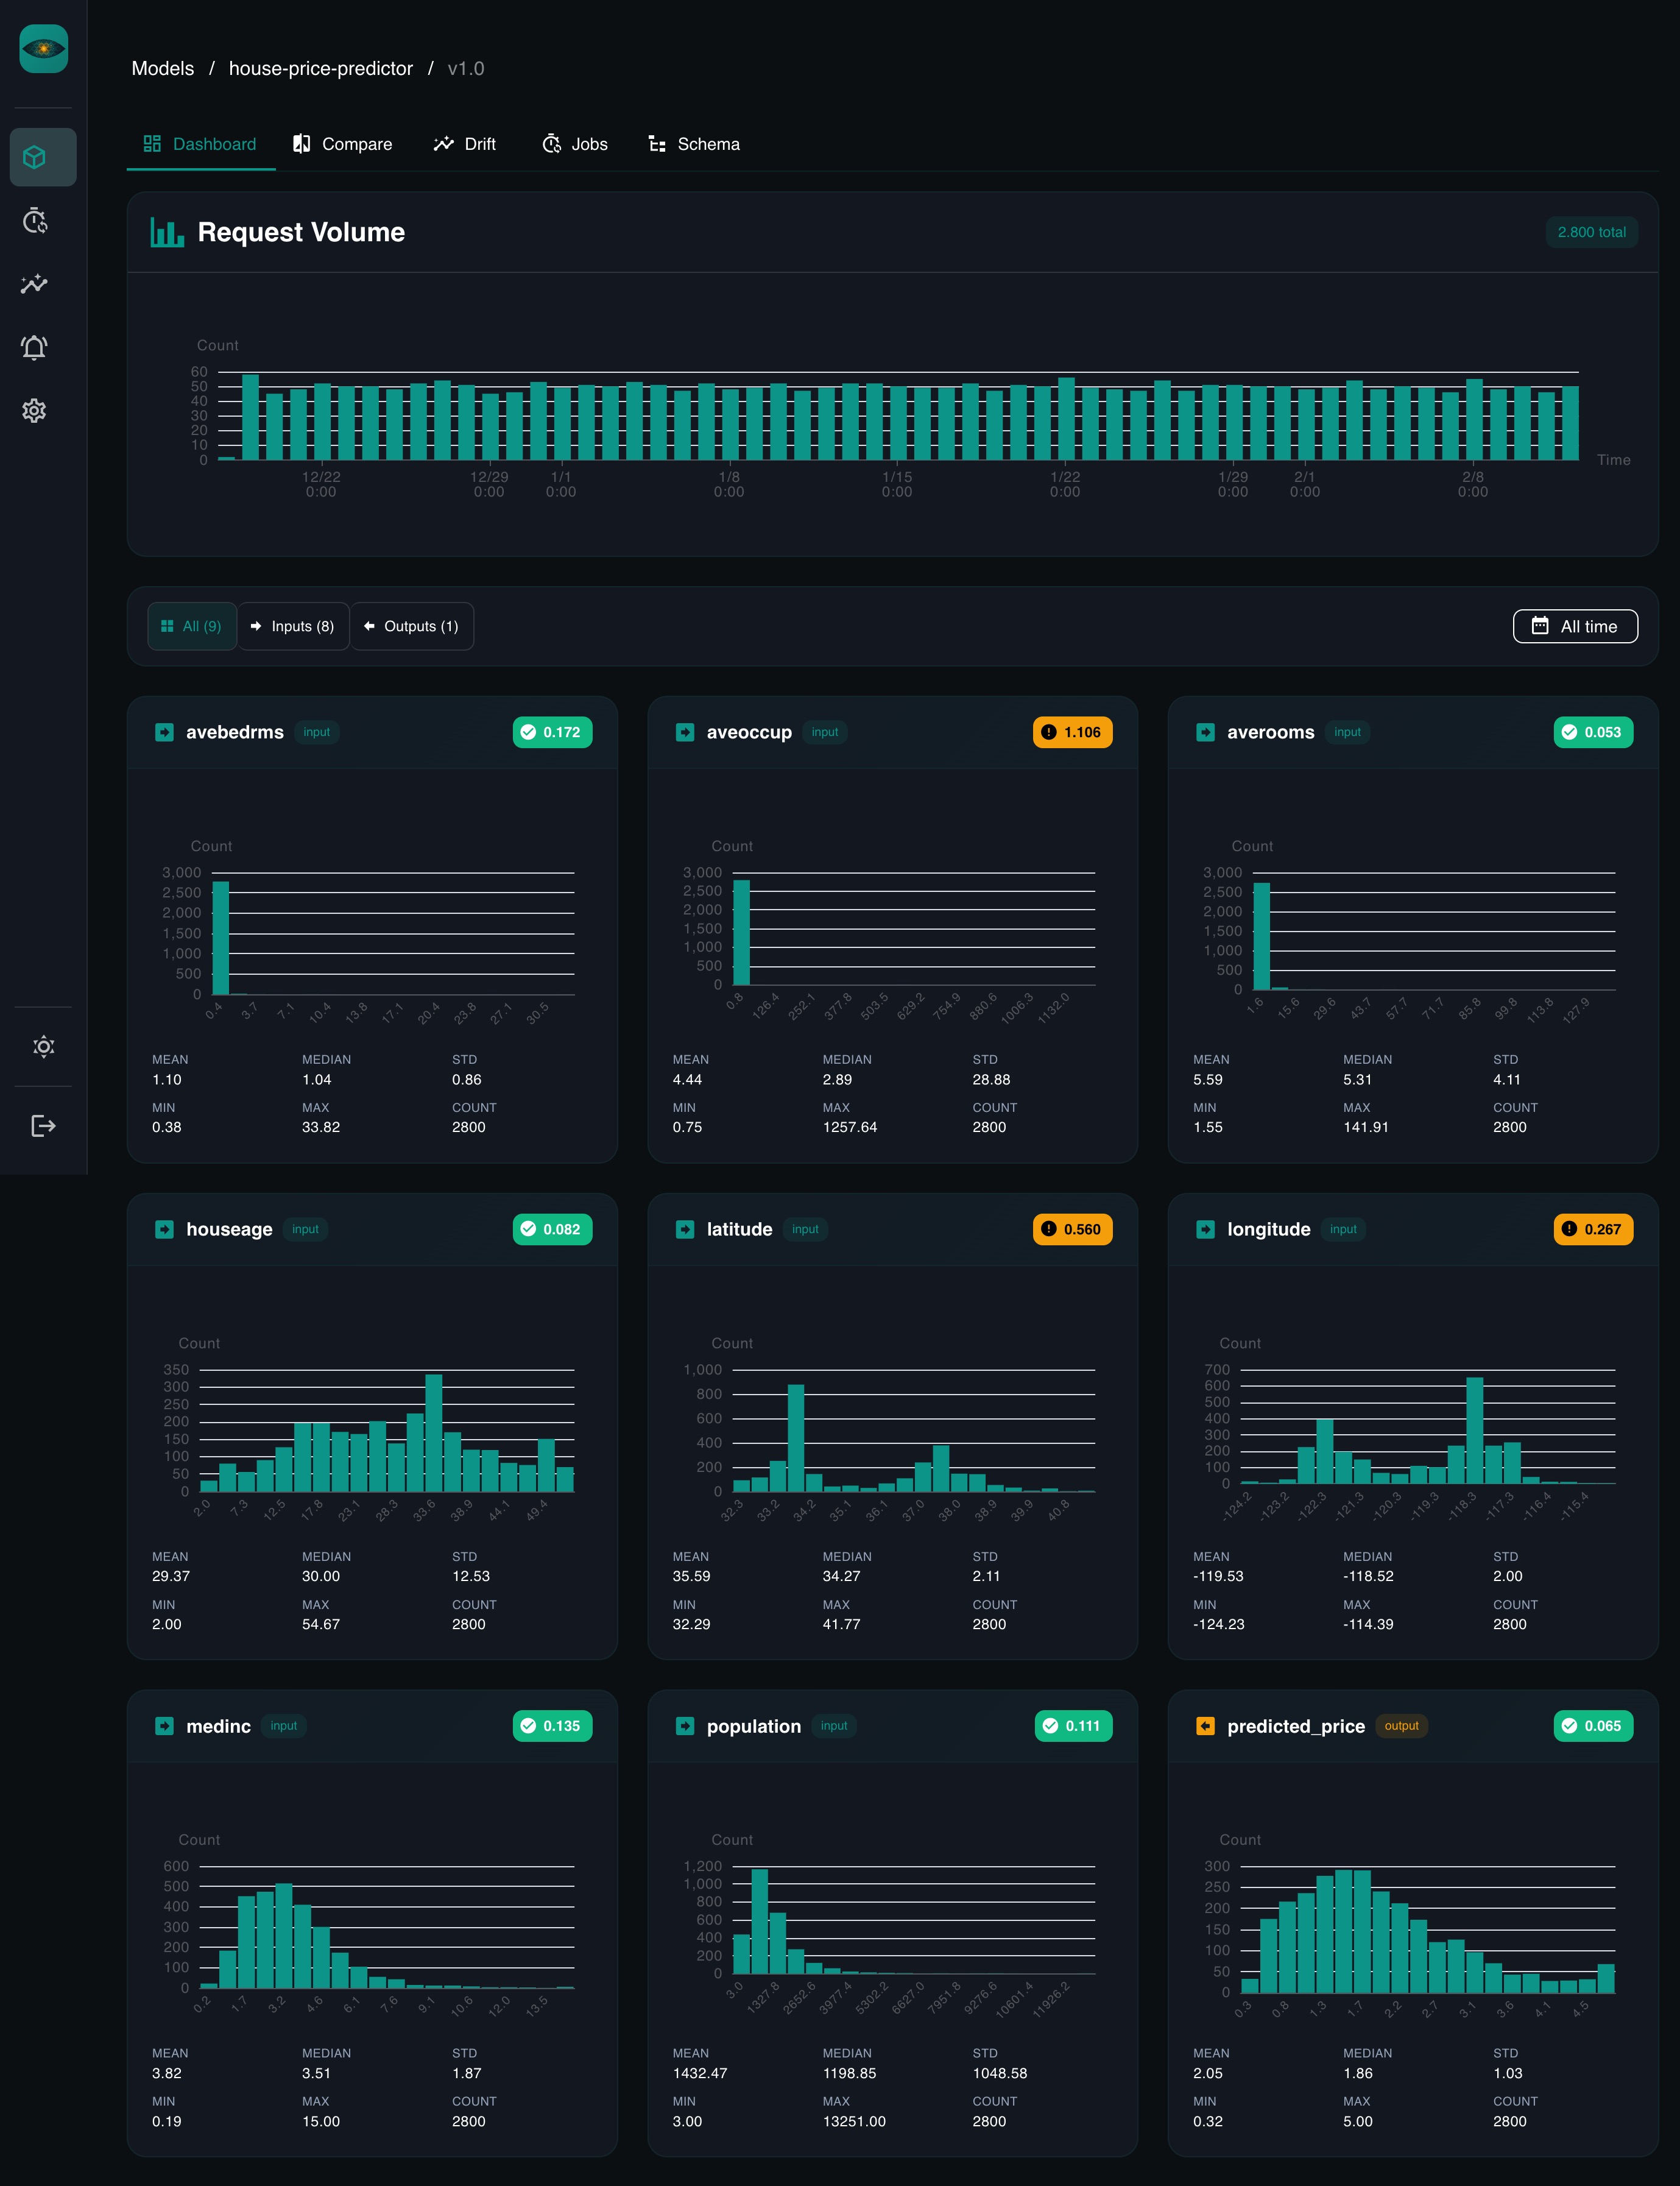
Dashboards -- for every field in your schema, YAAI generates a chart automatically. Numerical fields get histograms with summary stats. Categorical fields get bar charts. No configuration needed.
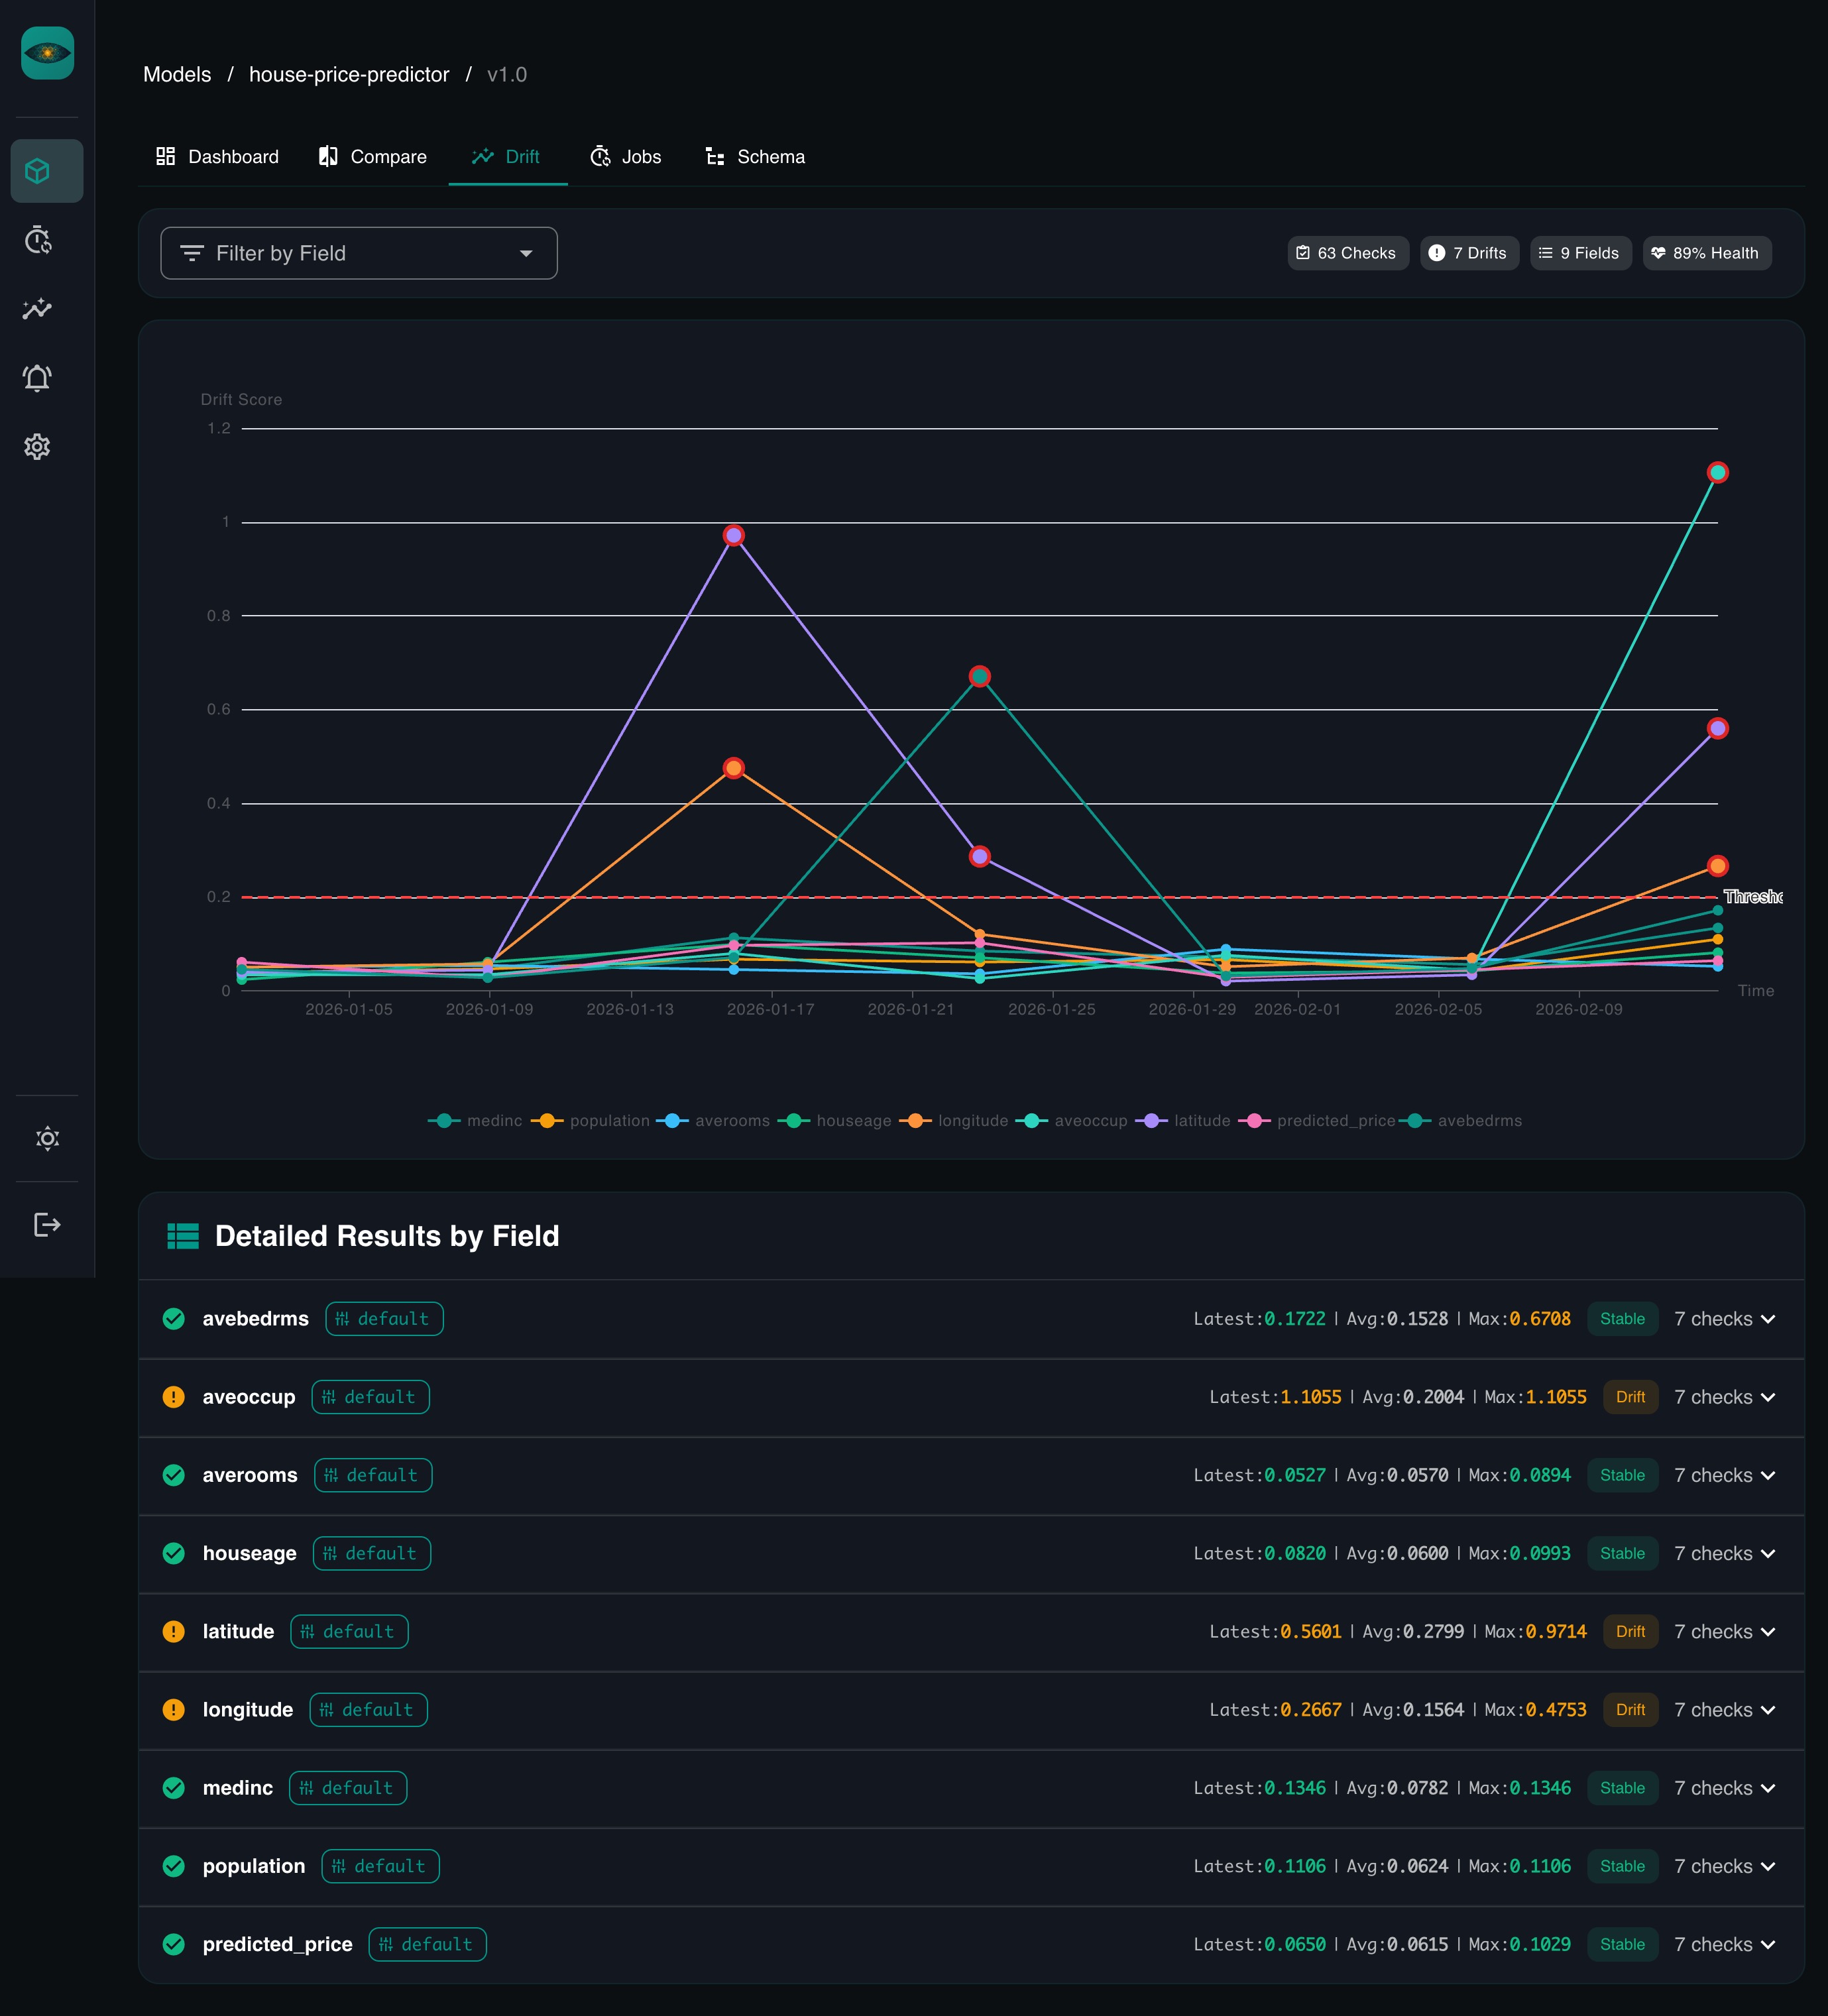
Drift detection -- when you created the model version, YAAI set up a default drift job (daily at 2am, comparing recent data against your reference data). It starts running as soon as reference data exists. You can also trigger it manually or change the schedule.
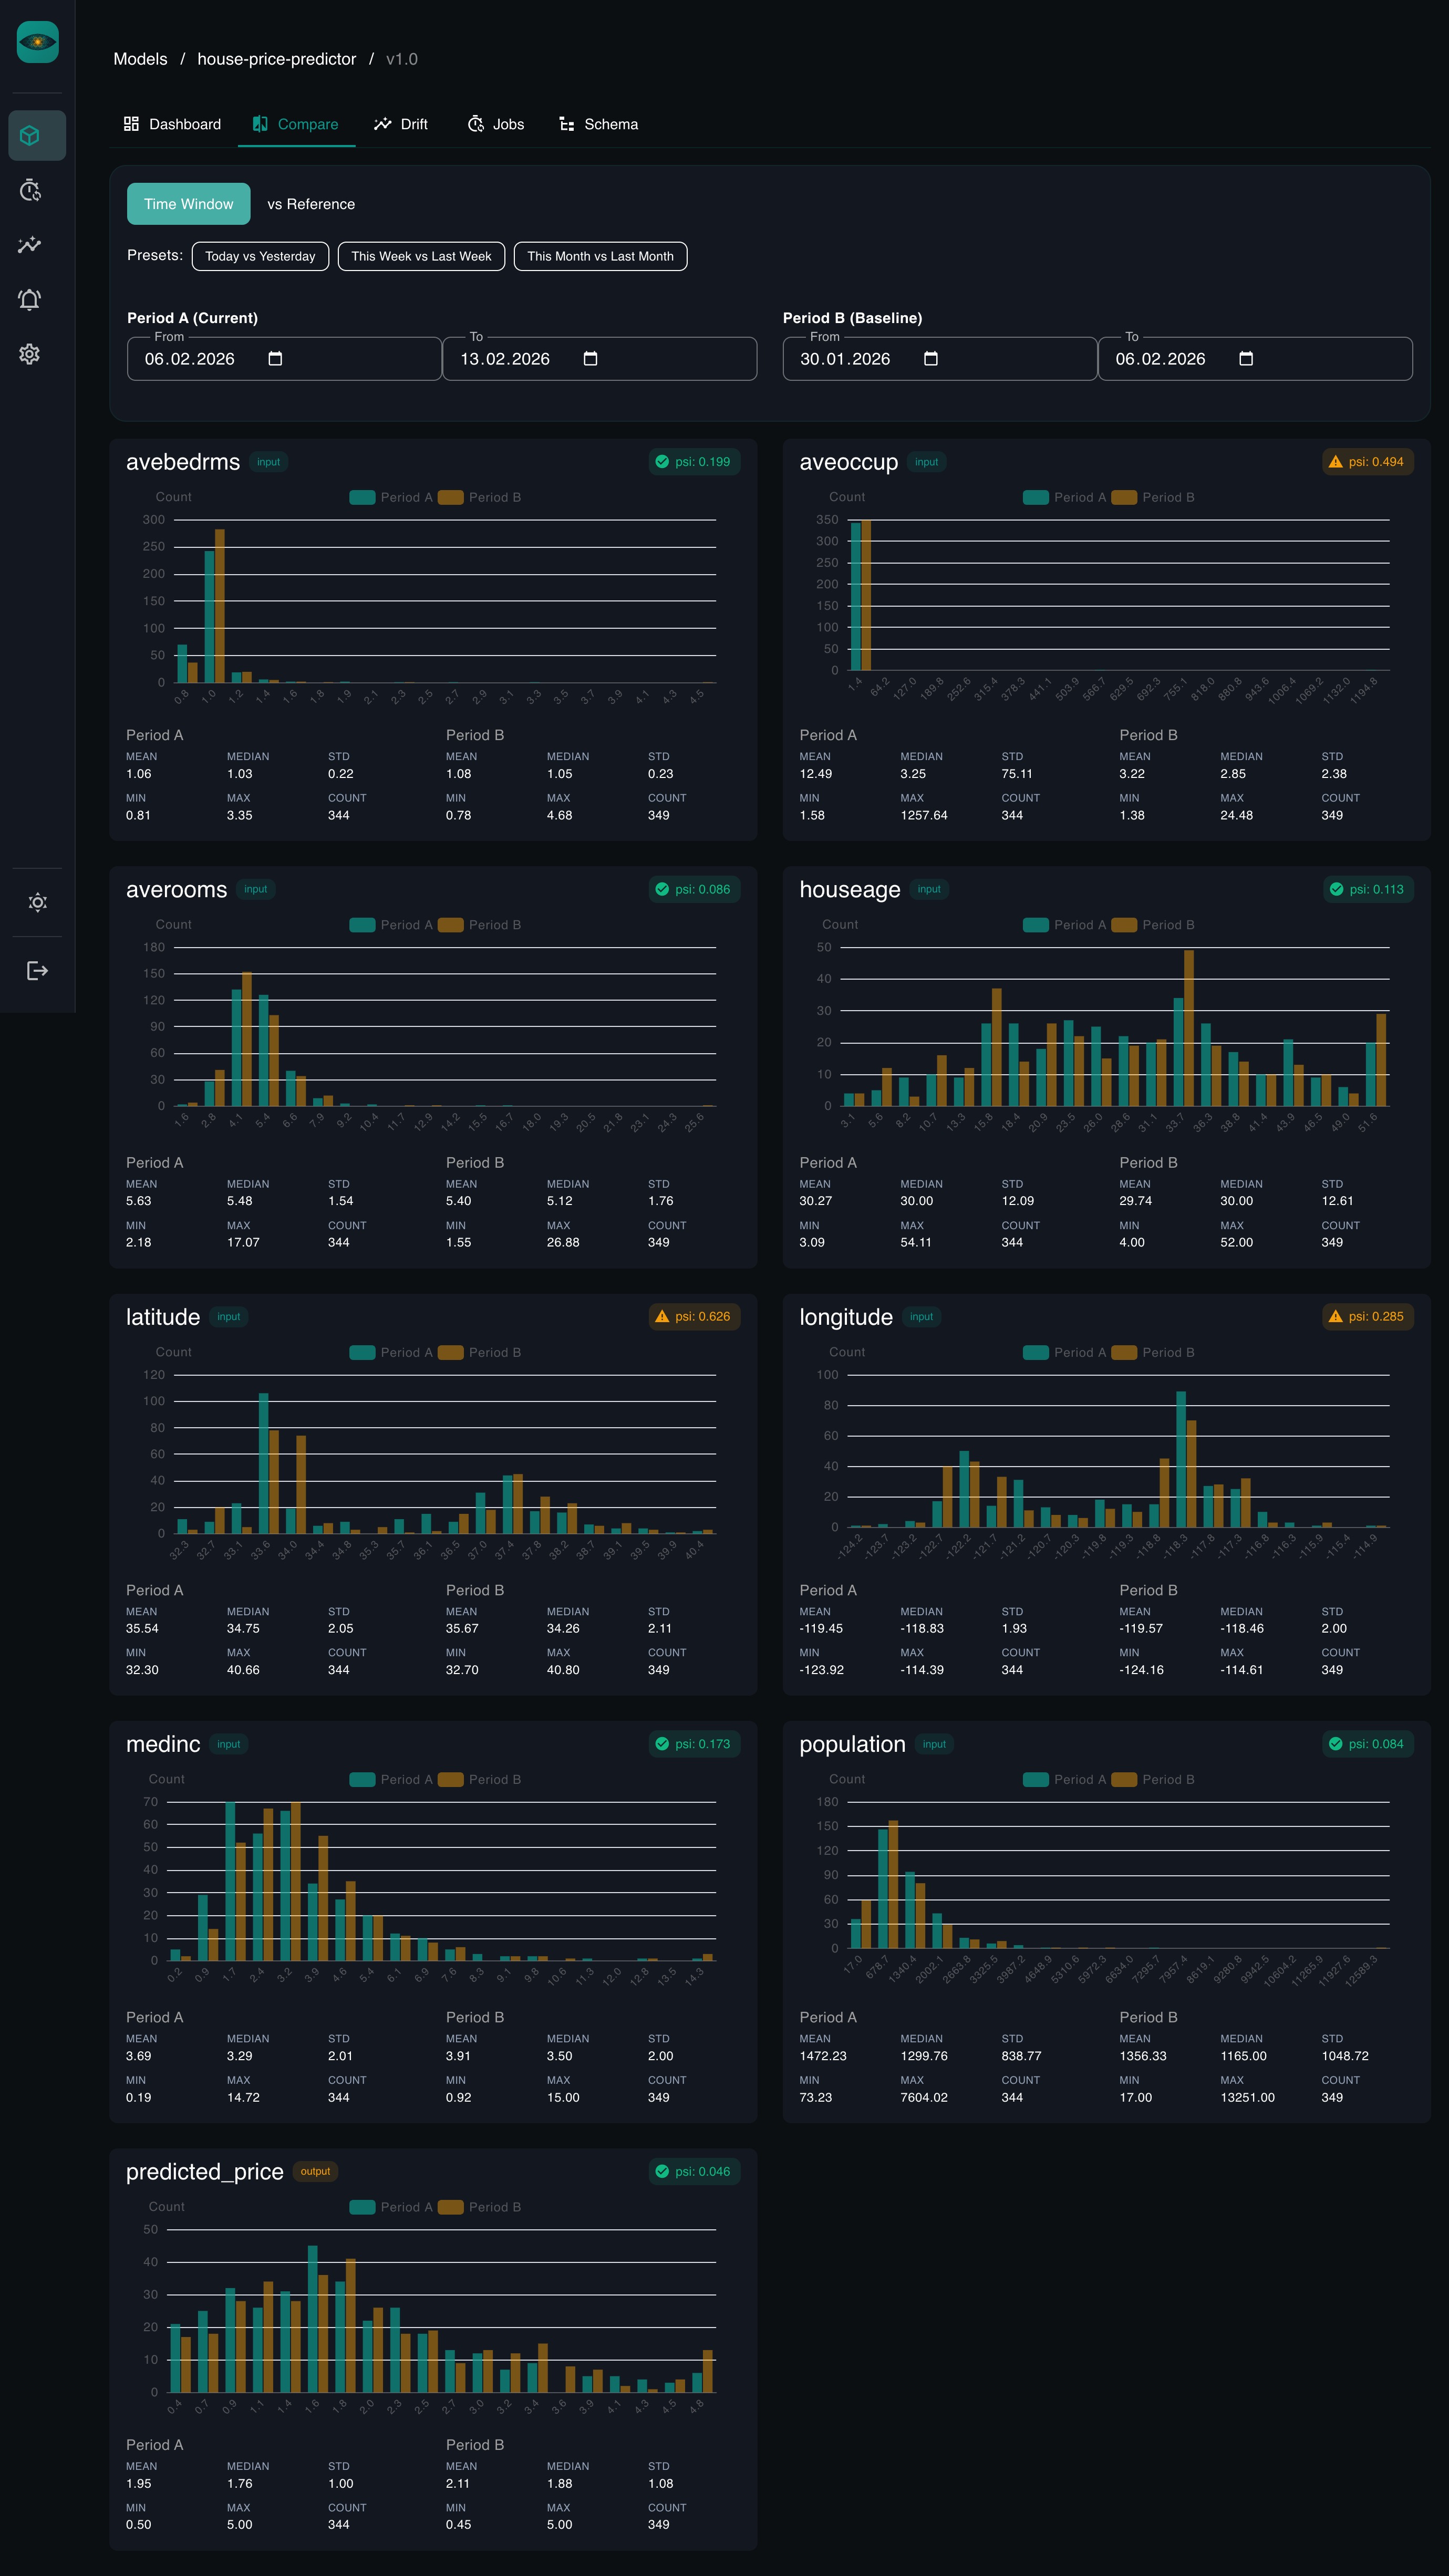
Comparisons -- pick any two time ranges and compare distributions side by side. Overlaid histograms for numerical features, grouped bar charts for categorical ones. PSI / KS / Chi-squared scores computed inline.
What to explore next
- Core Concepts -- understand models, versions, schemas, and how drift detection works
- Drift Detection Guide -- deep dive into PSI, KS test, Chi-squared, and Jensen-Shannon divergence with visual explanations
- REST API Reference -- the full OpenAPI spec
- Python SDK Reference -- all client methods with type signatures